


The InfoSparks tool, exclusively for SWMLS Members, provides detailed graphs and reports of market activity that can be shared with clients and can help to give the real estate professional better insight into their market areas they cover.
This short article covers an important section of the InfoSparks Charts, called Time Frames. The charts generated in InfoSparks can contain historical data going back more than 10 years and knowing how to use Time Frames like “Monthly” or a “Rolling 12 Months” will aid in your market research and will also help you sound like an expert in front of your clients.
Let’s get started by covering a few general statistic terms used in InfoSparks.
Line Graph – A line graph is a graphical display of information that changes continuously over time, using an x-axis and y-axis. A line graph may also be referred to as a line chart. Within a line graph, there are Data Points connecting the data to show a continuous change. The lines in a line graph can descend and ascend based on the data.
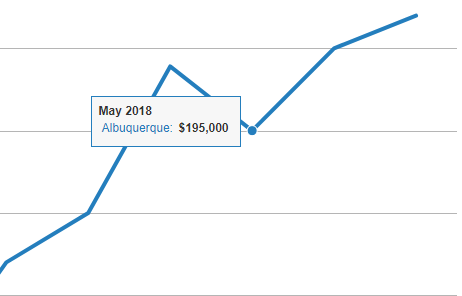
Data Point – A Data Point is the value for that market condition in that time frame. The number of homes for sale in May 2018 would be a data point, while the Average Sale Price or New Listings for May 2018 would also be data points. Data Points can be for a singular point in time or may contain a rolling average that generate the new data point for that month. Monthly is the primary Time Frame that can be used on InfoSparks reports. For example, in May 2018 the Median Sale Price was $195,000. When viewing the InfoSparks graph for Median Sales Price and setting the Time Frame to Monthly, the Data Point for May 2018 is $195,000. We learn see what happens in the next example when we change the Time Frame to a Rolling 3, 6, or 12 month range.
The image below shows an example of a Data Point when we hover the mouse over the dot for May 2018.
Time Frames -This term refers to how the monthly data will be displayed in the Line or Bar graphs generate in InfoSparks. “Monthly” is the most basic Time Frame which just provides a single data point for each month or year. For example, in a 3 year report showing the Median Sales Price by month there should be 36 individual data points (a data point for each month in that range).
The image below is the Time Frame drop down menu found in InfoSparks. You can choose 4 Time Frames for a Line Graph (5 for a Bar Graph).
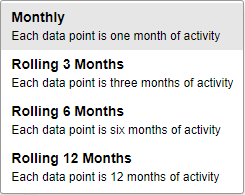
The additional Time Frames in InfoSparks are referred to as Rolling Averages. Rolling 3 Months, Rolling 6 Months, and Rolling 12 Months. “Rolling” is simply a term that means that the data being used to calculate the monthly value is always “moving” or “shifting” for each month.
Let’s focus on Rolling 12 months to better understand. In a Rolling 12 Month Time Frame each data point is 12 months of activity. From any given month, the system will go back 12 months and average the total count for the previous 12 months. In this Time Frame view, the historical line graph will generally appear smoothed out because there is more sample data for each point on the line. As with Rolling 12 Months, Rolling 6 Months and Rolling 3 Months represent rolling 6-month and 3-month segments of activity, respectively. Year to Date, which shows activity from January to the current month for the years shown, is only available in bar chart format.
Trouble understanding a Rolling Average? Below is a short video where we go further into Rolling Averages by using InfoSparks to visually discuss this concept.
If you have additional questions about using InfoSparks, please email us at mls@gaar.com or call 505-843-8833.
About the author: Jeffrey Bratton is the MLS Manager at Southwest Multiple Listing Service, Inc. A New Mexico resident for more than 30 years and UNM gradudate (Go Lobos), he begin his real estate career at the Albuquerque Metropolitan Board of Realtors in 2006 and provides technnical training and real estate support for the 3,500 REALTORS® and Appraisers in the Greater Albuquerque Area. In addition to managing the MLS system, he currently serves as a liasion for the MLS committees: SWMLS Policy Committee, SWMLS Compliance Committee, SWMLS Technology Task Force, and is also a member of the Real Estate Standards Organization (RESO) and Council of Multiple Listing Services (CMLS).
Comments