


Monthly sales drop 4.6% in December
Key Highlights
- In 2021, existing-home sales totaled 6.12 million – an increase of 8.5% from the prior year and the highest annual level since 2006.
- At the end of December, the inventory of unsold existing homes fell to an all-time low of 910,000, which is equivalent to 1.8 months of the monthly sales pace, also an all-time low since January 1999.
- In December, existing-home sales on a seasonally adjusted annualized rate slowed to 6.18 million, a 4.6% decrease from November.
WASHINGTON (January 20, 2022) – Existing-home sales declined in December, snapping a streak of three straight months of gains, according to the National Association of Realtors®. Each of the four major U.S. regions witnessed sales fall in December from both a month-over-month and a year-over-year basis. Despite the drop, overall sales for 2021 increased 8.5%.
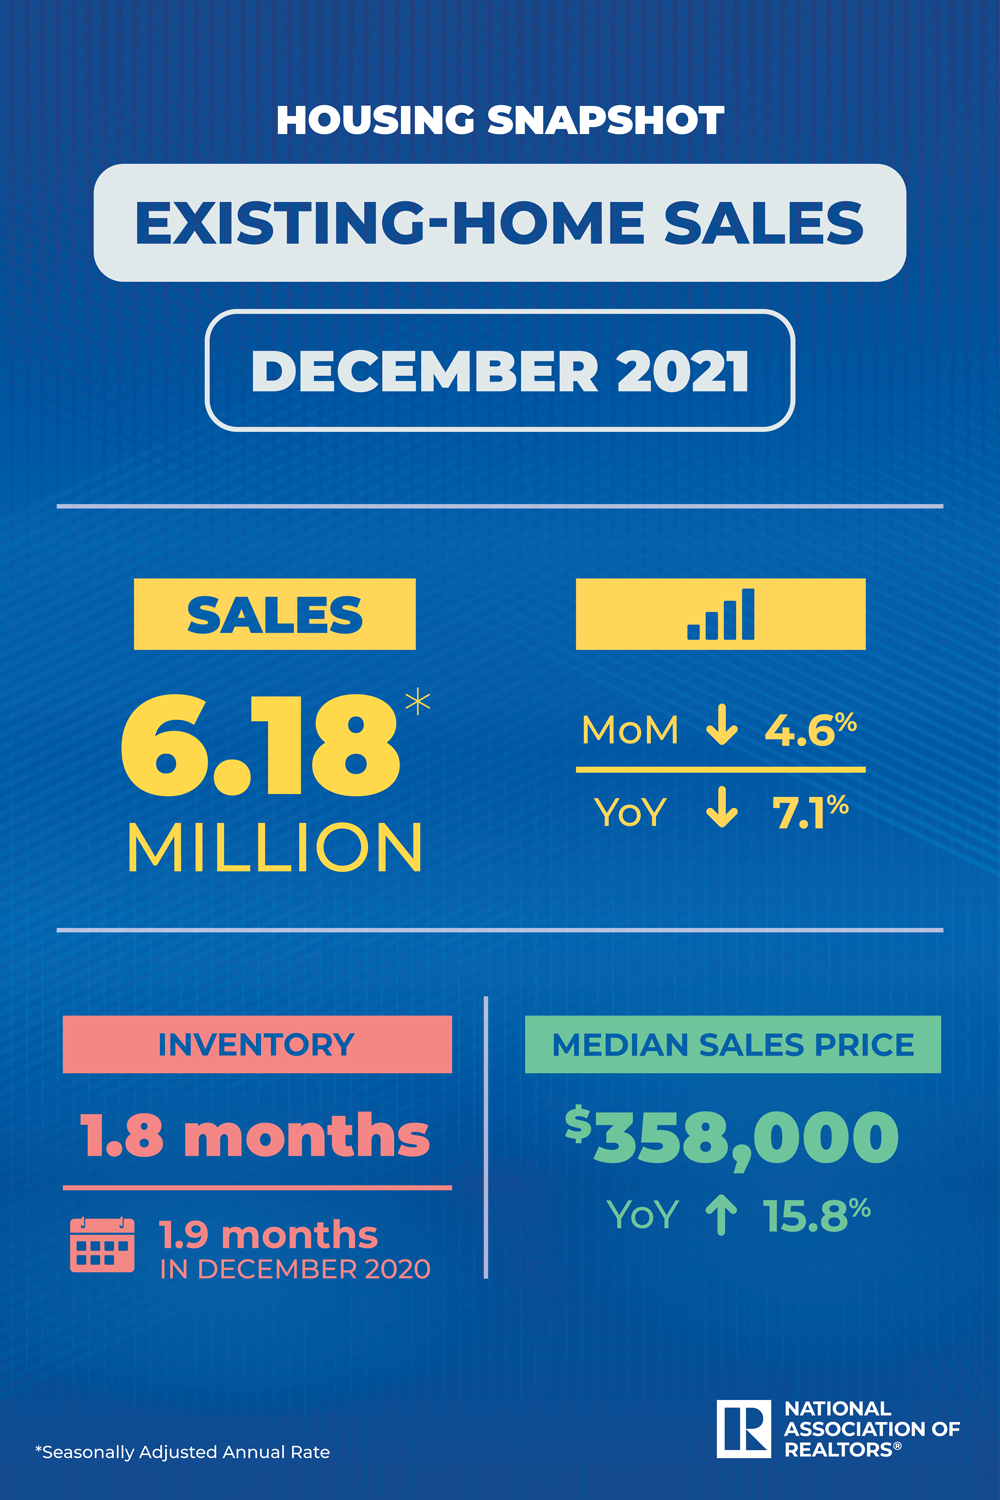
Total existing-home sales,1 https://www.nar.realtor/existing-home-sales, completed transactions that include single-family homes, townhomes, condominiums and co-ops, dropped 4.6% from November to a seasonally adjusted annual rate of 6.18 million in December. From a year-over-year perspective, sales waned 7.1% (6.65 million in December 2020).
"December saw sales retreat, but the pull back was more a sign of supply constraints than an indication of a weakened demand for housing," said Lawrence Yun, NAR's chief economist. "Sales for the entire year finished strong, reaching the highest annual level since 2006."
Yun, however, does expect existing-home sales to slow slightly in the coming months due to higher mortgage rates, but noted that recent employment gains and stricter underwriting standards ensure home sales are in no danger of crashing. He forecasts rates to remain below 4% by year-end and wages to hold firm due to a tight labor market.
"This year, consumers should prepare to endure some increases in mortgage rates," Yun cautioned. "I also expect home prices to grow more moderately by 3% to 5% in 2022, and then similarly in 2023 as more supply reaches the market."
Total housing inventory2 at the end of December amounted to 910,000 units, down 18.0% from November and down 14.2% from one year ago (1.06 million). Unsold inventory sits at a 1.8-month supply at the present sales pace, down from 2.1 months in November and from 1.9 months in December 2020.
"We saw inventory numbers hit an all-time low in December," Yun said. "Home builders have already made strides in 2022 to increase supply, but reversing gaps like the ones we've seen recently will take years to correct."
The median existing-home price3 for all housing types in December was $358,000, up 15.8% from December 2020 ($309,200), as prices rose in each region. The South witnessed the highest pace of appreciation. This marks 118 straight months of year-over-year increases, the longest-running streak on record.
Properties typically remained on the market for 19 days in December, one day more than the 18 days seen in November, and down from 21 days in December 2020. Seventy-nine percent of homes sold in December 2021 were on the market for less than a month.
First-time buyers were responsible for 30% of sales in December, up from 26% in November and down from 31% in December 2020. NAR's 2021 Profile of Home Buyers and Sellers – released in late 20214 – reported that the annual share of first-time buyers was 34%.
"There was a significant surge in first-time buyers at the end of the year," Yun said. "With mortgage rates expected to rise in 2022, it's likely that a portion of December buyers were intent on avoiding the inevitable rate increases."
Individual investors or second-home buyers, who make up many cash sales, purchased 17% of homes in December, up from 15% in November and up from 14% in December 2020. All-cash sales accounted for 23% of transactions in December, down from 24% in November, and up from 19% from December 2020.
Distressed sales5 – foreclosures and short sales – represented less than 1% of sales in December, equal to the percentage seen in both November 2021 and December 2020.
Realtor.com®'s Market Trends Report in December shows that the greatest year-over-year median list price growth occurred in Las Vegas (+32.4%), Austin (+28.8%), and Tampa (+25.4%). Austin also registered the highest growth in the number of homes which had their prices reduced compared to last year (+3.4 percentage points), followed by Pittsburgh (+3.2 percentage points) and Buffalo (+2.1 percentage points).
According to Freddie Mac, the average commitment rate for a 30-year, conventional, fixed-rate mortgage was 3.10 in December, up from 3.07 in November. The average commitment rate across all of 2021 was 2.96%.
Single-family and Condo/Co-op Sales
Single-family home sales dropped to a seasonally adjusted annual rate of 5.52 million in December, down 4.3% from 5.77 million in November and down 6.8% from one year ago. The median existing single-family home price was $364,300 in December, up 16.1% from December 2020.
Existing condominium and co-op sales were recorded at a seasonally adjusted annual rate of 660,000 units in December, down 7.0% from 710,000 in November and down 9.6% from one year ago. The median existing condo price was $305,100 in December, an annual increase of 11.9%.
"We wrapped up the year witnessing home sales exceed the previous year's total and saw millions of families secure housing," said NAR President Leslie Rouda Smith, a Realtor® from Plano, Texas, and a broker associate at Dave Perry-Miller Real Estate in Dallas. "I think the positive momentum will continue as the market prepares to finally see more supply in the coming months, meaning more buyers will be able to land their dream home."
Regional Breakdown
Existing-home sales in the Northeast fell 1.3% in December, registering an annual rate of 750,000, a 15.7% decrease from December 2020. The median price in the Northeast was $384,600, up 6.3% from one year ago.
Existing-home sales in the Midwest slid 1.3% to an annual rate of 1,500,000 in December, a 2.6% decline from a year ago. The median price in the Midwest was $256,900, a 10.0% climb from December 2020.
Existing-home sales in the South retreated 6.3% in December, posting an annual rate of 2,700,000, a drop of 5.3% from one year ago. The median price in the South was $323,000, a 20.2% ascension from one year prior.
Existing-home sales in the West decreased 6.8%, reporting an annual rate of 1,230,000 in December, down 10.2% from one year ago. The median price in the West was $507,100, up 8.4% from December 2020.
The National Association of Realtors® is America's largest trade association, representing more than 1.5 million members involved in all aspects of the residential and commercial real estate industries.
NOTE: NAR's Pending Home Sales Index for December is scheduled for release on January 27, and Existing-Home Sales for January will be released on February 18; release times are 10:00 a.m. ET.
1 Existing-home sales, which include single-family, townhomes, condominiums and co-ops, are based on transaction closings from Multiple Listing Services. Changes in sales trends outside of MLSs are not captured in the monthly series. NAR rebenchmarks home sales periodically using other sources to assess overall home sales trends, including sales not reported by MLSs.
Existing-home sales, based on closings, differ from the U.S. Census Bureau's series on new single-family home sales, which are based on contracts or the acceptance of a deposit. Because of these differences, it is not uncommon for each series to move in different directions in the same month. In addition, existing-home sales, which account for more than 90% of total home sales, are based on a much larger data sample – about 40% of multiple listing service data each month – and typically are not subject to large prior-month revisions.
The annual rate for a particular month represents what the total number of actual sales for a year would be if the relative pace for that month were maintained for 12 consecutive months. Seasonally adjusted annual rates are used in reporting monthly data to factor out seasonal variations in resale activity. For example, home sales volume is normally higher in the summer than in the winter, primarily because of differences in the weather and family buying patterns. However, seasonal factors cannot compensate for abnormal weather patterns.
Single-family data collection began monthly in 1968, while condo data collection began quarterly in 1981; the series were combined in 1999 when monthly collection of condo data began. Prior to this period, single-family homes accounted for more than nine out of 10 purchases. Historic comparisons for total home sales prior to 1999 are based on monthly single-family sales, combined with the corresponding quarterly sales rate for condos.
2 Total inventory and month's supply data are available back through 1999, while single-family inventory and month's supply are available back to 1982 (prior to 1999, single-family sales accounted for more than 90% of transactions and condos were measured only on a quarterly basis).
3 The median price is where half sold for more and half sold for less; medians are more typical of market conditions than average prices, which are skewed higher by a relatively small share of upper-end transactions. The only valid comparisons for median prices are with the same period a year earlier due to seasonality in buying patterns. Month-to-month comparisons do not compensate for seasonal changes, especially for the timing of family buying patterns. Changes in the composition of sales can distort median price data. Year-ago median and mean prices sometimes are revised in an automated process if additional data is received.
The national median condo/co-op price often is higher than the median single-family home price because condos are concentrated in higher-cost housing markets. However, in a given area, single-family homes typically sell for more than condos as seen in NAR's quarterly metro area price reports.
4 Survey results represent owner-occupants and differ from separately reported monthly findings from NAR's REALTORS® Confidence Index, which include all types of buyers. Investors are under-represented in the annual study because survey questionnaires are mailed to the addresses of the property purchased and generally are not returned by absentee owners. Results include both new and existing homes.
5 Distressed sales (foreclosures and short sales), days on market, first-time buyers, all-cash transactions and investors are from a monthly survey for the NAR's REALTORS® Confidence Index, posted at nar.realtor.
Source: "Annual Existing-Home Sales Hit Highest Mark Since 2006"
Comments