


REALTORS® and Appraisers at Southwest MLS have access to a variety of different real estate applications to help in their business. One of these applications is InfoSparks that provides custom market metrics and charts that can easily be shared with your clients and on social media.
Highlights of what you can do with InfoSparks:
- Compare up to four geographies at a time
- Filter search results by countless housing variable combinations
- Examine housing market metrics as counts, medians, and averages
- Customize price and square footage ranges
- Use on your mobile device
- Share search results online, in print, via email and even with live data widgets!
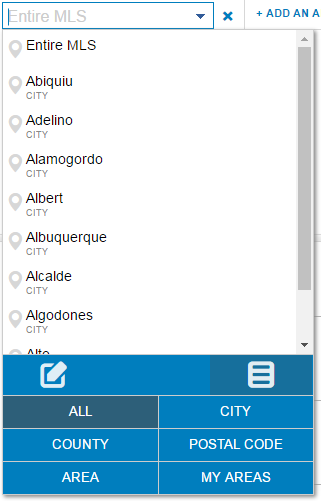
Compare Geographies
InfoSparks allows you to create your own customized map or set of maps by selecting different geographies or design a map of your own specifications.
Analyze Data
With InfoSparks you can select a variable category for all types, in selectable groups or singularly. Narrow your search by location, price range, property type, bedroom count and more.
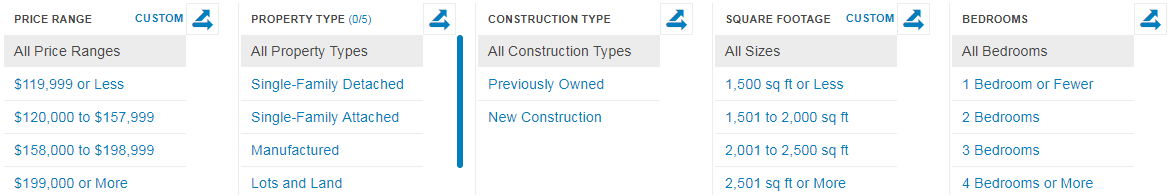
- Price Range: Ranges adjust for each area based on its sales history. Sold home prices are used when filtering by price for metrics with calculations based on sold data, and original list prices are used when filtering by price for non-closed metrics. Price ranges are customizable.
- Property Type: Separates properties by Single-Family Detached, Single-Family Attached, Manufactured, Lots and Land, and Sale.
- Construction Type: Separates activity by Previously Owned and New Construction.
- Square Footage: Separates activity by properties with 1,500 sq ft or less, 1,501 to 2,000 sq ft, 2,001 to 2,500 sq ft and 2,501 sq ft or more. This variable is also customizable.
- Bedrooms: Separates activity by properties with 1 Bedroom or fewer, 2 Bedrooms, 3 Bedrooms, and 4 Bedrooms or more.
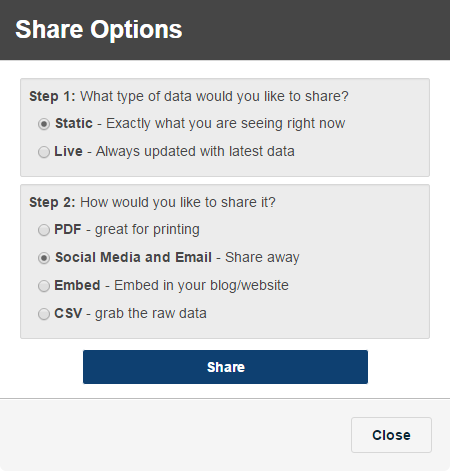
Branded Charts and Sharing
InfoSparks allows you to share embedded charts on blogs, websites and social media profiles so they’re always up to date, or download raw data to create your own branded charts for marketing purposes.
InfoSparks Metrics Explained

- Sales Price: Calculations are based on sold data. Prices do not account for seller concessions. Median represents the point at which half of the homes that sold in a given month were priced higher and half were priced lower. Average is the mean sales price for all closed sales in a given month.*
- New Listings: A count of the properties that have been newly listed on the market in a given month.
- Homes for Sale: The number of properties available for sale in active status at the end of a given month. Also known as inventory. For this metric, the "12/6/3 months" calculation is the average of the most recent 12/6/3 months of data.
- Pending Sales: A count of the properties on which contracts have been accepted in a given month.
- Closed Sales: A count of the actual sales that have closed in a given month. Calculations are based on sold data.
- Days on Market: Median or average number of days between when a property is listed and when an offer is accepted in a given month.*
- Months Supply: The inventory of homes for sale at the end of a given month, divided by the average monthly Pending Sales from the last 12 months. Also known as absorption rate.
- Pct of List Price: Percentage found when dividing a listing's sales price by its list price, then taking the average or median for all sold listings in a given month, not accounting for seller concessions. Calculations are based on sold data. Example: A property is listed at $200,000, reduced to $190,000 and taken off the market. Then the same property is listed again at $180,000 a few months later and is further reduced to $175,000. It closes for $160,000. We take the ratio of $160,000: $175,000 or 91.4% instead of $160,000:$200,000 because a new listing ID was issued.
- Price Per Sq Ft: Calculations are based on sold data. Prices do not account for seller concessions. Median represents the point at which half of the homes that sold in a given month were priced higher and half were priced lower, divided by the number of finished square feet. Average is the mean sales price for homes sold in a given month divided by the number of finished square feet.*
- Dollar Volume: The total dollar amount of all sales for the selected criteria.
- Shows to Pending: The number of showings scheduled per listing that went into pending status during the selected reporting period. Data begins in January 2018.**
- Shows Per Listing: The average number of showings scheduled on active listings for the selected time period. Data begins in January 2018.**
How to access InfoSparks
SWMLS Subscribers can access InfoSparks 2 ways:
- By logging into the GAAR Member Portal and clicking on the InfoSparks button from the home page
- By going to FLEX and choosing Menu>Products>InfoSparks.
SWMLS offers InfoSparks training several times a year. Please contact the SWMLS Help Desk at mls@gaar.com or 505-843-8833 for any questions about InfoSparks or to find when the next training class is scheduled.
Comments