


Homebuyers usually have a general idea of where they want to buy their home but rely on your knowledge of the market to narrow down specific areas. However, some buyers know exactly what neighborhoods they are interested in, sometimes even down to the street.
Your client may want to move into the neighborhood where their friends or family members live, or one with a pool, close to a grocery store, etc., With InfoSparks’ mapping interface tool and unique filtering options, you can easily collect and compare customized home statistics in up to four of their specific areas of interest. These statistics will ultimately help your clients find the best house to fit their needs.
Follow the directions below to get started.
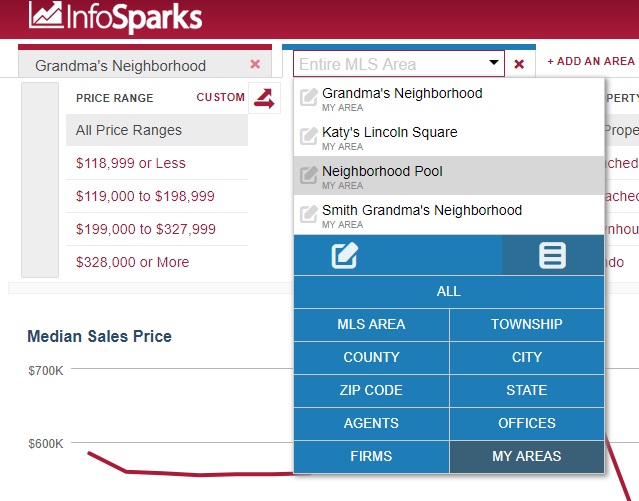
1. Login to InfoSparks, click on “My Areas” tab in the main menu at the top of your screen.

2. In the mapping interface tool, draw a shape to select a specific area that represents your client’s first area of interest.
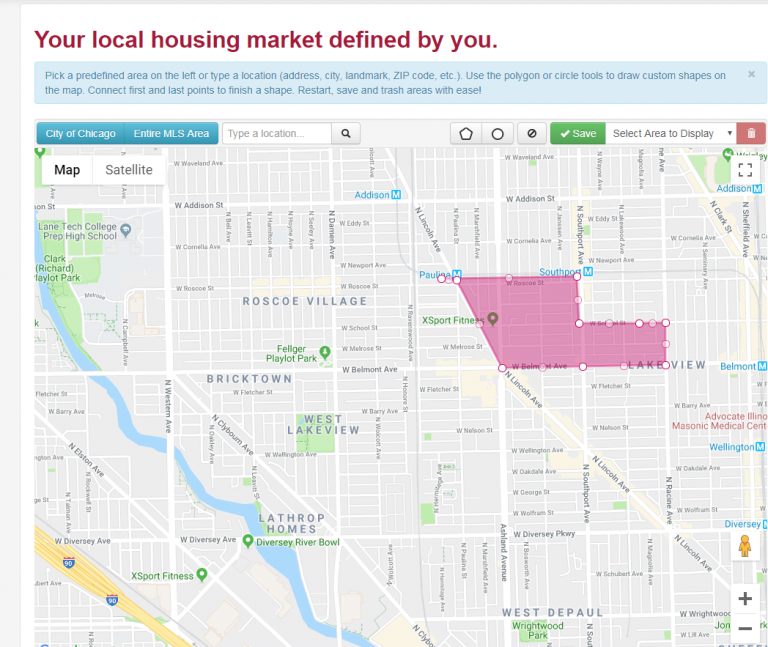
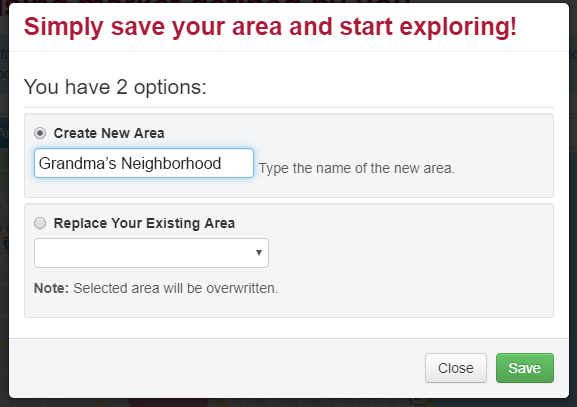
3. Once highlighted, click the “Save” button. A box will pop up with your options so you can label the area.
4. Return to the map, clear your current shape, and define a new area.
Draw a shape around the client’s second area of interest and click “Save.”
After both shapes have been saved, return to the InfoSparks homepage where you will set up a report to compare the two areas. Click on the drop-down box in the upper left-hand corner of the screen and choose “My Areas.” Then select your first saved area.
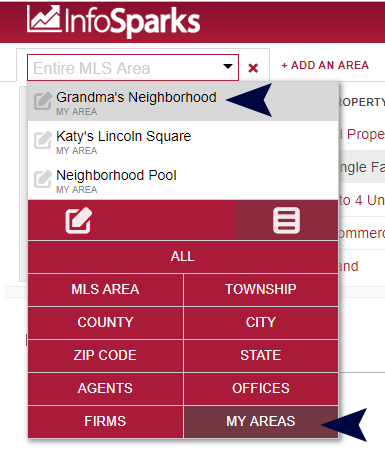
5. Click “Add an Area” and then select your second saved area from the drop-down menu.
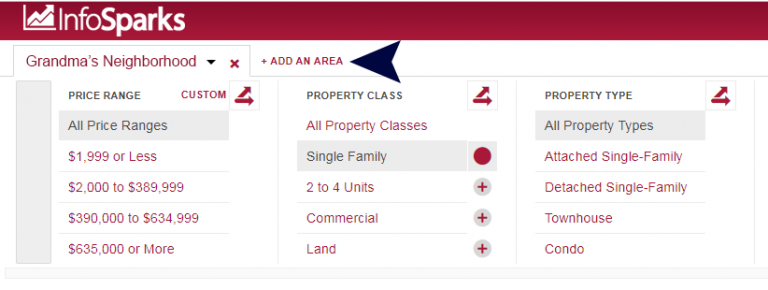
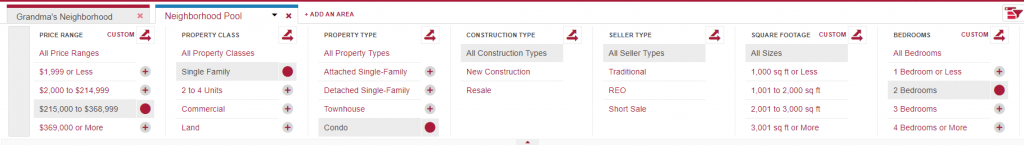
6. Select the categories that are important to your clients for your comparison such as price and number of bedrooms.
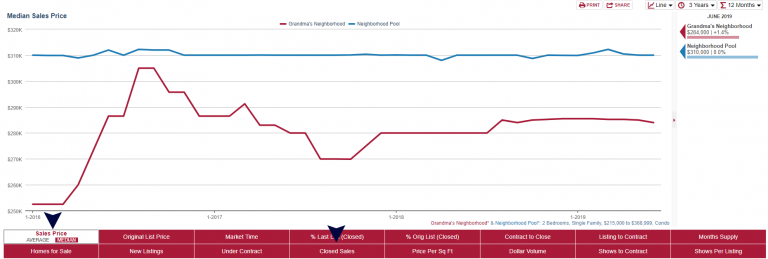
7. Then, choose the type of data you want to compare.
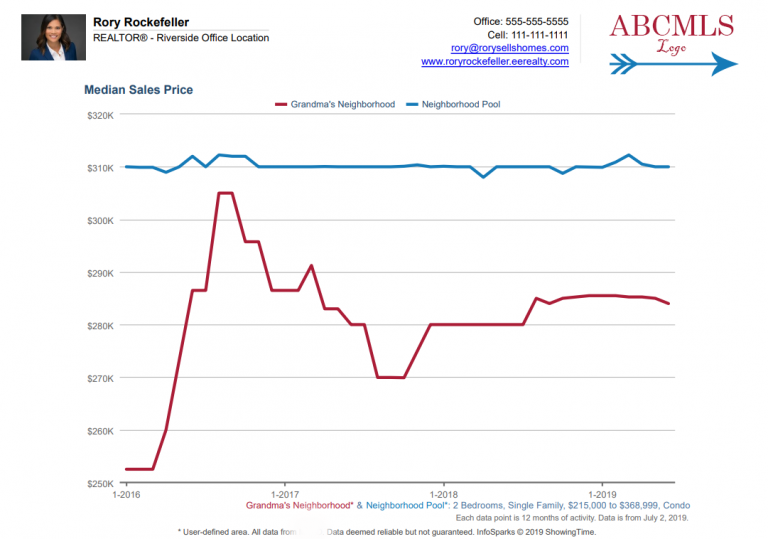
8. The personally branded chart is available to print or share.
Comments