


The Greater Albuquerque Association publishes market statistics reports several times a year with monthly, quarterly, and annual data provide on a regular schedule. REALTORS® at Southwest MLS have access to a variety of market reports and analytical tools to give better insight into the local markets around the state.
While being familiar with regional and national trends is helpful, it’s the local market dynamics that home buyers and sellers want to know. A well-crafted report that distinguishes national vs. regional vs. local trends enables you to advise buyers and sellers based on relevant data.
Take a moment to learn about the tools available to you as a SWMLS Subscriber.
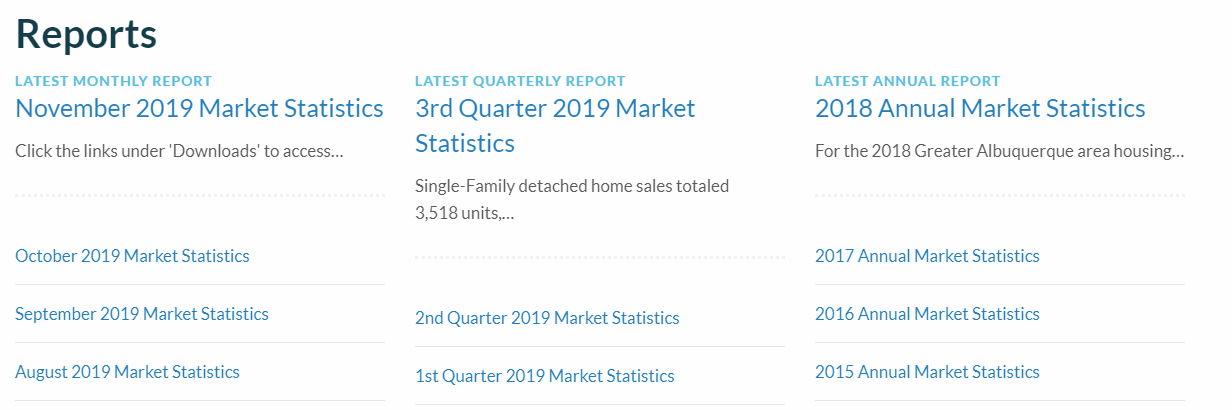
Where to Find the GAAR Market Reports
https://www.gaar.com/market-statistics is your go-to place for the published reports from GAAR. Monthly stats are posted on the 10th (business day) of each month and Quarterly reports are posted on the 20th (business day) of each quarter.
The reports feature market trends and graphs on the different markets in the Greater Albuquerque Area and are broken down by Single Family and Condo/Townhomes.
Position Yourself as the Market Expert with InfoSparks
ShowingTime’s MarketStats products provide an easy way to aggregate listing data in a manner that conveniently enables you to identify and understand market trends and share this information with your clients. InfoSparks and FastStats are two of the primary market products that are included as a member benefit to SWMLS REALTORS®.
You can create personalized reports to use in listing presentations with prospective clients that include different variables such as property type, square footage, number of bedrooms and more. The use of stats is an increasingly integral part of the home buying process and can be used to market, educate, prove experience and ease buyers’ uncertainty and anxiety.
InfoSparks can be found in the Flex Product Menu or from the GAAR Portal. GAAR offers training throughout the year on the MarketStats with our next class being offered on January 14, 2020. Click here to sign up.
Generate Statistics from the Quick Search
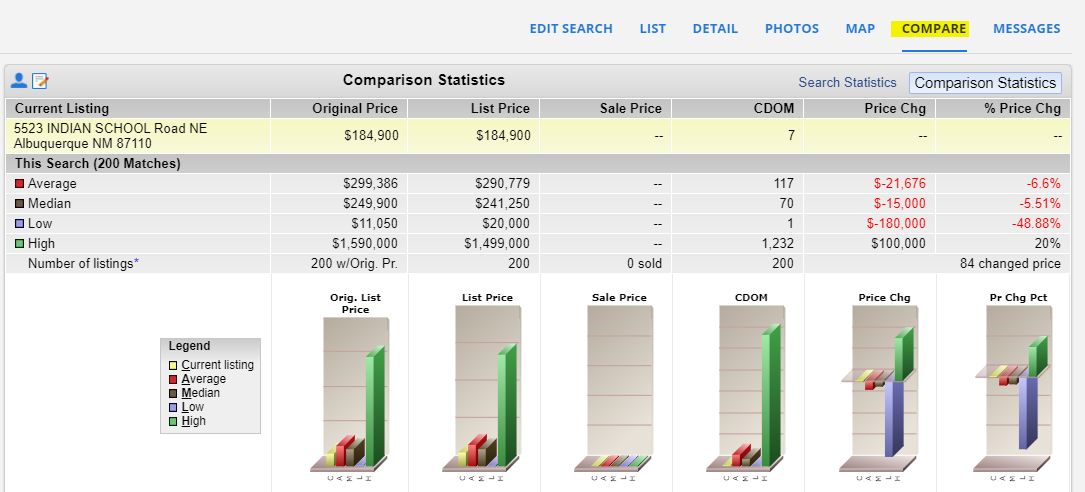
When viewing your search results in Flex you can use the Compare tab to display statistical comparisons between listings in the search results.
Click Comparison Statistics on the Compare tab to view statistical comparisons between a selected listing and the other listings in the search. You can view the average, median, low and high values for the original price, list price, sale price, DOM, price change, and percent price change.
Production Stats using Flexmls
Flexmls features more than 10 different reports that any REALTOR® can use to generate their annual production numbers from current and prior offices. Qualifying Brokers at an office can also use these reports to generate production for their entire office or company. The Flex production reports are located in the Flex Menu>Statistics>Inventory and Production.
Difference between Average and Median
Average or Mean – According to the Oxford English Dictionary, the mean is, “the value obtained by dividing the sum of several quantities by their number; an average.” The mean of a set of numbers is equivalent to the average. So, for example, the mean of one and 100 is 50.5.
Median – The median is “denoting or relating to a value or quantity lying at the midpoint of a frequency distribution of observed values or quantities, such that there is an equal probability of falling above or below it.” So, if you have a set of numbers and you put them in numerical order, the median is the middle number in the set. If you have an even amount of numbers, the median is the average of the middle two numbers. For example, in the set one, two, three, four, five and six, both three and four fall in the middle. Therefore, the median number is 3.5 because it is the average of the two.
Let’s say you are trying to help your client determine where to price their home. You may think that telling them the mean (average) sales price for homes of their size and bed/bath count* in their ZIP Code would be an efficient way to decide on a reasonable list price. However, the mean is easily affected by outliers. Maybe a comparable home that would usually sell for $250,000 sold for $500,000 because it used to belong to a famous singer. This large leap in sales price will affect the mean in the area, making it higher than it actually should be. By using the median, you will get a more realistic value because you won’t need to account for the one leap in price.
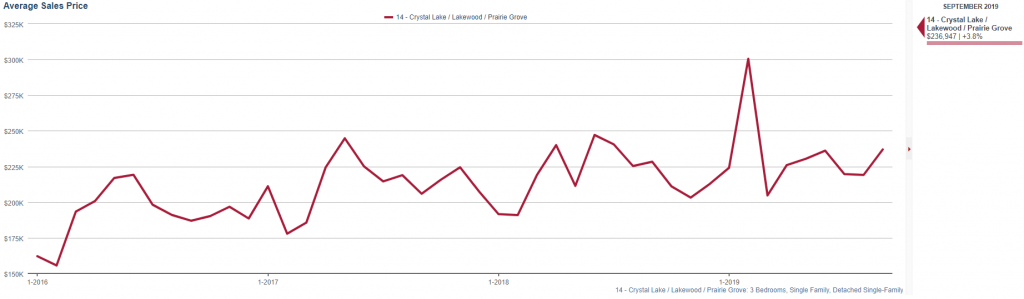
Here are some example charts from InfoSparks that show a similar situation. The average sales price for three-bedroom, detached single-family homes in September 2019 in this area was $236,947.
But, the median sales price of those same data parameters was only $225,950.
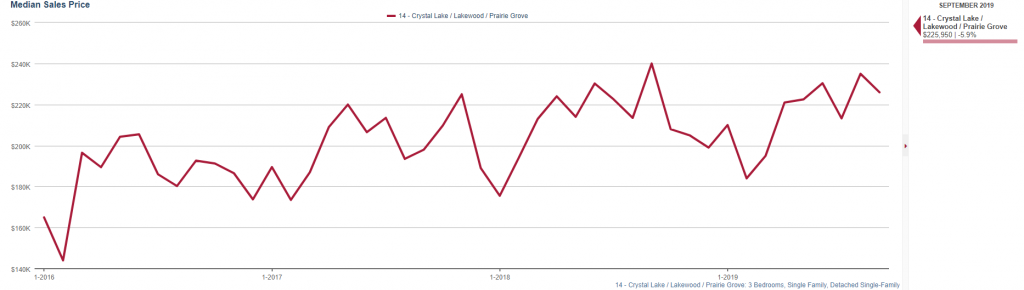
If an agent used the average sales price when deciding on a home’s list price with their client, and then the house sold for $226,000, the client would be upset because they were looking to sell for closer to $236,000. However, if the agent used the median price, they would be able to more accurately detail what the client could expect.
As always, there are many variables to data and each market is unique; however, understanding the difference between these two values is imperative when utilizing MarketStats data to better serve your clients.
If you would like more information about the GAAR Market Reports, SWMLS Statistical tools, or interest in having an InfoSparks training at your office please contact SWMLS at 505-843-8833 or email us at mls@gaar.com.
Comments