


You probably are familiar with the GAAR Monthly market reports that are posted on the 10th of each month. Did you know that you can access these Monthly reports two days earlier in FastStats, and also access archived monthly reports from previous years? FastStats is part of the InfoSparks program, a free real estate statistics tool for any SWMLS Subscriber.
The most concise report, the Local Market Updates, fits on a single page and allows you to quickly assess key metrics for a neighborhood, city or county (available in some markets). A report showing Marked Updates by Zip Code is also available.
Where can you find your Local Market Update report?
First, you will need to access InfoSparks from the FLEX Menu>Products or from the GAAR Member Portal. Then select FastStats from the Top menu in Infosparks. FastStats has the Local Market Update section on the left side menu. Choose the area and the period available for your market and click “Get Report.”
What questions does a Local Market Updates report help answer?
Looking at the top you can quickly answer three questions:
1.) Have more listings been added to the market?
2.) Have more listings been sold in the past month compared to the same month a year ago?
3.) Were more homes available at the end of the month?
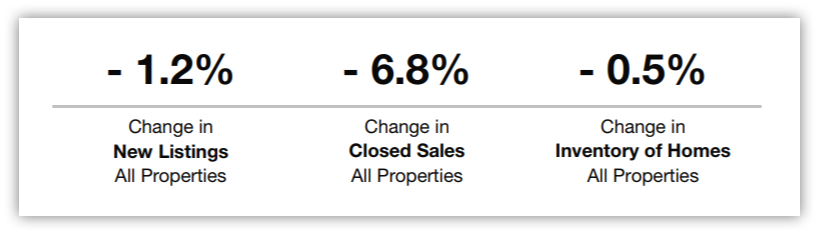
What’s the difference between New Listings and Inventory of Homes, and what does that tell you?
The New Listings metric provides a count of the properties that have been newly listed on the market in a given month.
Inventory of Homes records the number of properties available for sale in ‘active’ status at the end of a given month.
Looking at the two numbers side by side paints a good picture of the flow of the properties through the market. If the two numbers are similar, we can be sure that the market is a seller’s market.
What time frames can you sort by in the Local Market Updates report?
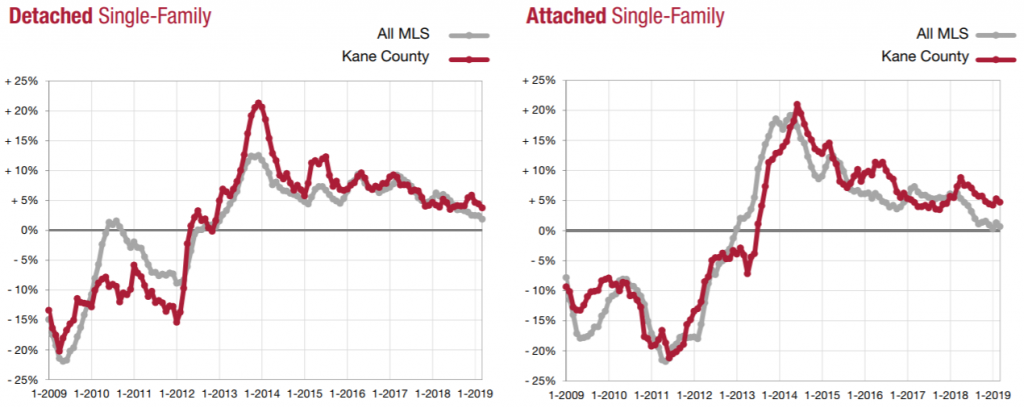
The report looks at two key periods; 1.) A monthly comparison between the current month and the same month the previous year. 2.) The trailing 12 months.
What’s the difference?
The first metric compares a snapshot of two points in time to understand if your local market area was doing the same, better or worse at this time a year ago. The types of homes compared may differ depending on your particular MLS, but it will most often include single-family detached and single-family attached categories.
How can the Local Market Updates report help me?
Like other FastStats reports, the Local Market Update provides you with an opportunity to strengthen your understanding of the latest neighborhood trends. Local Market Updates reports are also shareable with your current and prospective clients, making for an excellent marketing tool.
You can also take advantage of Local Market Updates charts and graphics to tell a compelling story about market conditions for your followers on social media or for recipients of your monthly newsletter.
Jeffrey Bratton is the MLS Manager at Southwest Multiple Listing Service, Inc. This New Mexico native and UNM graduate (Go Lobos) began his real estate career at the Albuquerque Metropolitan Board of Realtors in 2006 and provides technical training and real estate support for the 3,600 REALTORS® and Appraisers in the Greater Albuquerque Area. In addition to managing the MLS system, he currently serves as a liaison for the MLS committees: SWMLS Policy Committee, SWMLS Compliance Committee, SWMLS Technology Task Force, and is also a member of the Real Estate Standards Organization (RESO) and Council of Multiple Listing Services (CMLS).
Comments