


On July 18th, along with ShowingTime for the MLS, a powerful new statistics product was introduced to GAAR and SWMLS from 10K Research and Marketing as a member benefit.
Why the change? Overwhelmingly, SWMLS users needed more robust statistics and reporting for the market(s) they serve. That demand inspired SWMLS to conduct research into a tool that would allow users to manipulate, customize and generate better reports, while retaining functionality for all levels of users, from the curious enthusiast to the seasoned statistics guru.
The new Monthly Indicators report gives an extensive look at the SWMLS market, and provides detailed analytics for REALTORS®, Appraisers and consumers alike.
Not only did the monthly reports receive a facelift, you are now able to create custom statistical reports in real time with live data to further expand on your analysis of the market. These new tools are Infosparks and FastStats, and they are awesome!
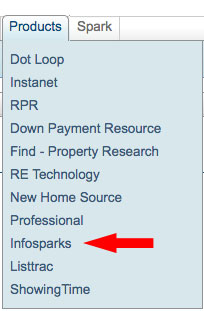
As a SWMLS user, you are now able to access both tools directly from Flexmls. Simply hover over ‘Products’ and select ‘Infosparks.’
Now you have statistical reporting tied directly to live MLS data!
Here are some of the amazing things you will see once you have accessed the Infosparks dashboard:

Infosparks takes live MLS data and allows users to select different areas (up to four at a time), price ranges, property types, construction types, square footage and bedrooms.
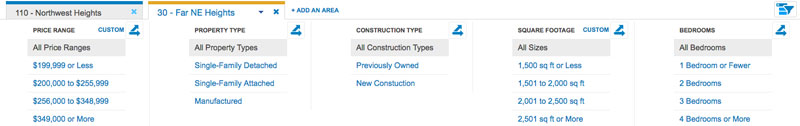
Clicking on the expands the qualifiers. For example:
Unselected
Selected

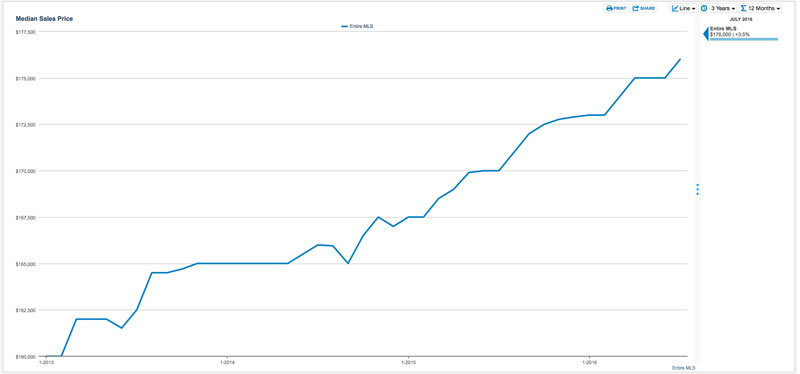
Then, select the analytics from the bottom of the screen.

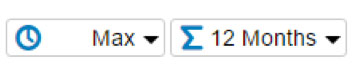
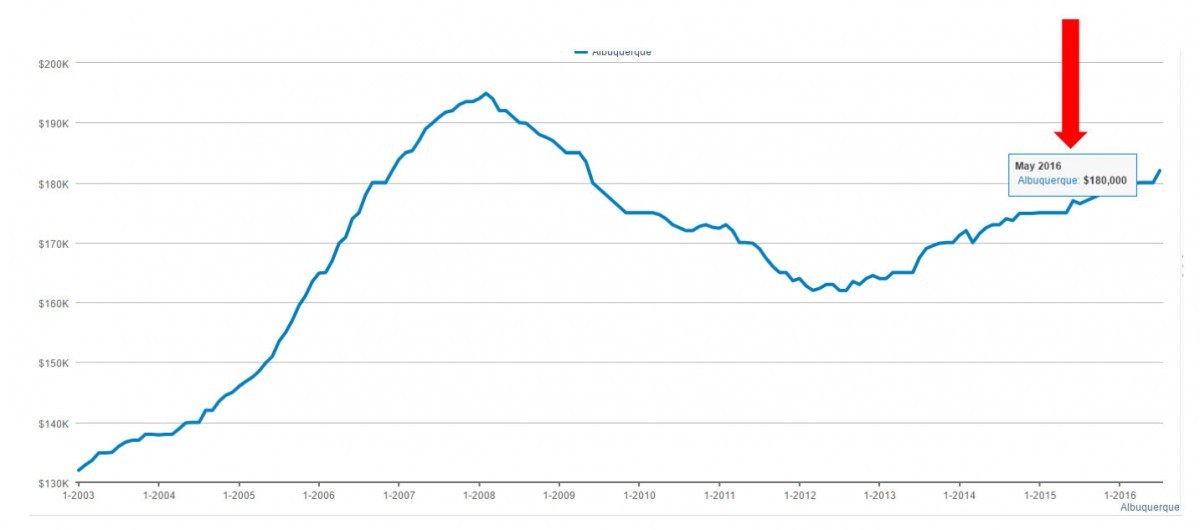
In the middle right-hand side of the screen, change your chart’s time frame (1/3/5/10/Max years), as well as monthly or rolling data (monthly is month-by-month, while rolling follows more of a trend-line).
Hover your mouse over the chart to see the exact data at any point on the chart.
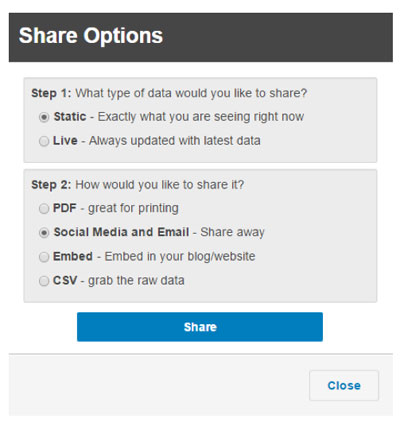
The reports you create in Infosparks are easily shareable, whether using the static data (will not change from what you see), to live (always changing with the MLS data). Share via PDF, social media/e-mail, embed to a website, or export to CSV and create your own metrics in Excel.
Let’s head over to FastStats.

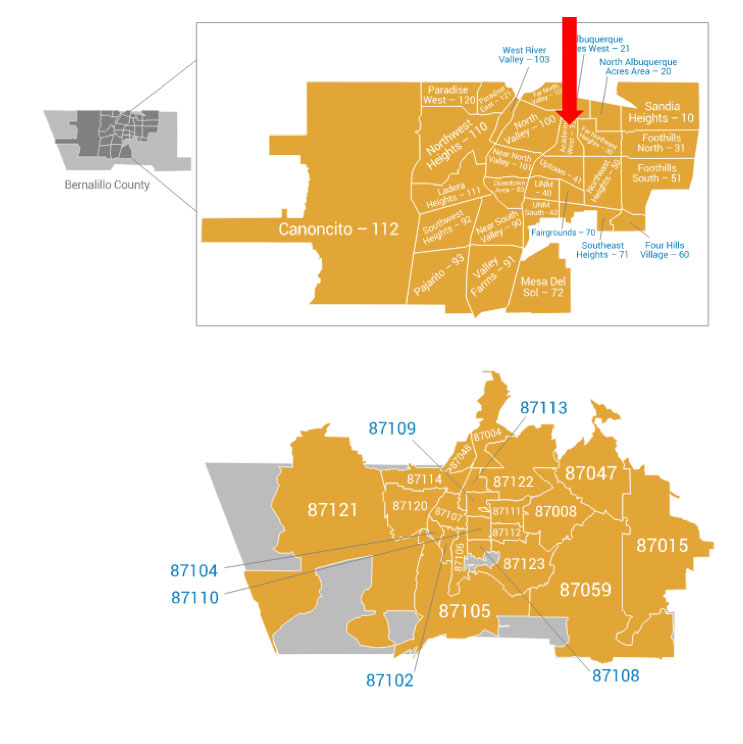
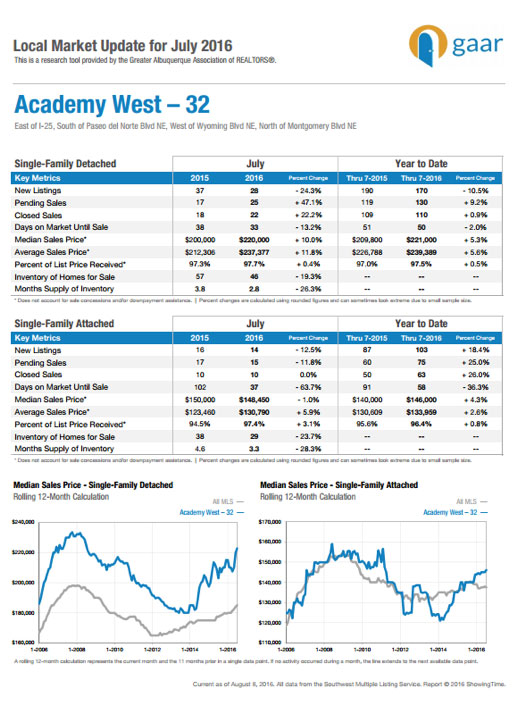
FastStats provides local data by area or zip code for a specific month. Either by selecting the area from the menu on the left, or using the map, select the area you are researching and what is produced is a fully comprehensive Market Update for that area!
Have some questions regarding how to use all the functions on this incredibly powerful tool? Visit the ‘User Manual & FAQ’ tab at the top of the dashboard for a wealth of training videos and instructions.
Check out the full demonstration of both products from the video below:


Comments